
AFREC Funded On-Farm Research Trials
Beginning in 2017, AFREC funded an independent agronomist to conduct on-farm trials across the state of Minnesota. Utilizing precision agriculture data that many farmers are already recording, the trials were integrated into each farmer’s existing fertility plan and required minimal extra work and time for the farmer and their advisor.
Below are the insights from the trial.
2019 Research Trials
In 2019, 28 sites were established to measure corn and soybean yield responses to increased and decreased rates of nitrogen, potassium and sulfur fertilizer. These trials were replicated treatments that are designed to provide sound data. Since these trials only show data from 1-3 years, use the data to show trends and ideas for your crop management decisions, but combine it with other information and experiences from your own farm.
Findings from the 2019 Data
Below are a few key charts and graphs that showcase the results from the 2018 data. These charts are showcasing the raw data simply put into a chart to provide easier analysis and viewing. There are five different charts available for display:
- Overall Corn Yield Performance
- Overall Soybean Yield Performance
- Corn Yield by Precipitation
- Corn Yield by Soil Texture
- Corn Yield by Trial Timing
The application rates for these trials are as follows below:
- Nitrogen – farmer rate was the MRTN recommended rate and low rate is minus 50 lb/ac and high rate was plus 50 lb/ac.
- Sulfur – application rates were 0, 25, and 50 lb/ac.
- Potash – application rates were 0, 120, and 240 lb/ac of K2O.
NOTE: to view details of the bars, hover your mouse over the bar to see the number of trials in each data average and other details related to the chart.
CHART 1
The chart above shows the average corn yield performance in bushels per acre in each of the application rate categories measured.
Insights from this graph:
- For nitrogen, we saw a significant impact in low-rate N in comparison to farmer rate and high-rate N. An average difference of over 18 bushels. When looking at farmer rate and high-rate N, there is an average of a 2.4 bushel difference.
- For potassium, the trials showed no significant different in the yield performance between the application rates.
- For sulfur, the trials showed no significant difference in the yield performance between the application rates.
CHART 2
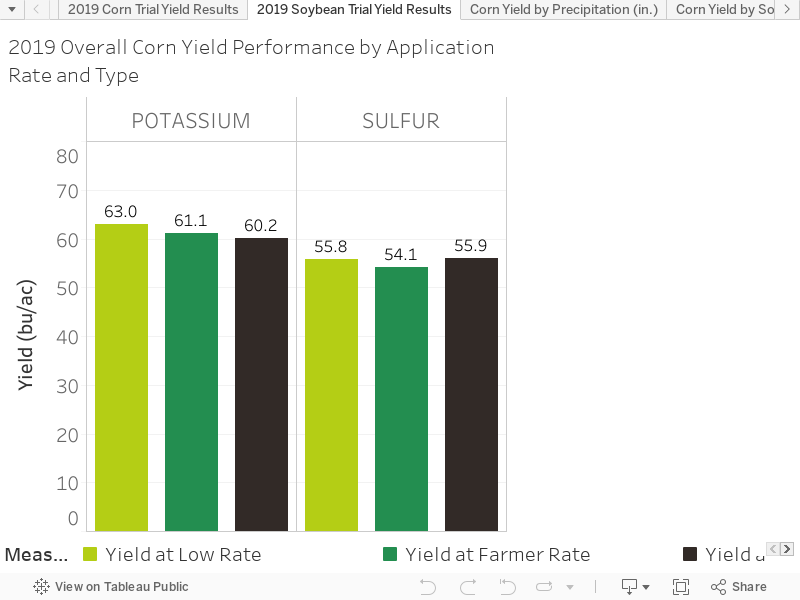
The chart above shows the average soybean yield performance in bushels per acre in each of the application rate categories measured.
Insights from this graph:
- For potassium and sulfur the soybean yields did not show a significant different in performance with added amounts of each of the nutrients. For potassium, it showed a negative yield response in one trial for the addition of potassium. For sulfur, there was one trial and it show inconclusive results.
CHART 3
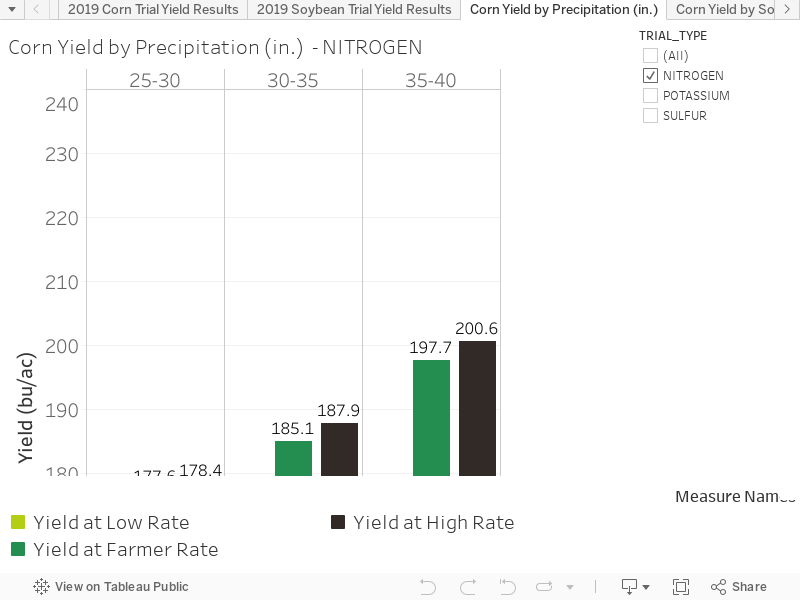
The chart above shows the variable corn yield performance in bushels per acre for each trial by precipitation rate in inches during the growing season of March – September.
Insights from this graph:
- For nitrogen application, across all of the precipitation ranges, low-rate N performed the lowest in terms of overall corn yield. Showcasing an average decrease in overall yield by over 17 bushels. When looking at farmer rate and increased rates of nitrogen, these performed closer in each of the precipitation rates. As precipitation rate increased, the performance of high-rate N also increased reaching over an average of 200 bushels per acre with 35-40 inches of rain in the growing season.
- For potassium, yield performance was more varied across the growing season precipitation ranges. The results measured do not indicate any argument for increased or decreased application rates of potassium on corn as it relates to precipitation levels.
- For sulfur, there was a smaller trial count compared to the other nutrients which explains the lack of precipitation ranges. When looking at the data retrieved from the trials conducted, it shows no indication of influence in yield with changes in sulfur application rate at the 30-35 inches of precipitation in the growing season.
CHART 4
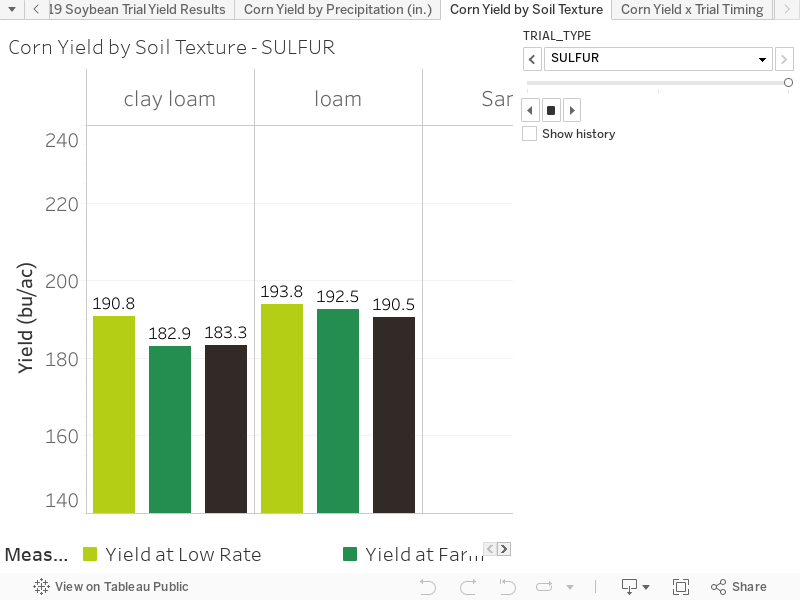
The chart above displays the yield results in bushels by soil textures found in each of the application rates.
Insights from this graph:
- For nitrogen, across the soil textures, low rate performed significantly less than farmer rate and high-rate nitrogen. For clay loam soils, farmer rate nitrogen performed the highest in terms of yield measuring 3.1 bushels per acre higher than the increased rate. For all the other soil textures, high-rate nitrogen did perform higher in terms of yield, but in some types, not enough to justify the return economically.
- For potassium, there is not an overarching trend to take away from the applications across the soil textures. When looking at clay loam specifically, farmer rate potassium showcased the highest response followed by high-rate potassium. In loam textures, low-rate potassium showed the highest yield response with decreasing performance as the application rate got higher.
- When looking at sulfur, the data points showed a varied response to application rates across the soil textures with low-rate sulfur showcasing the most consistent performance in yield.
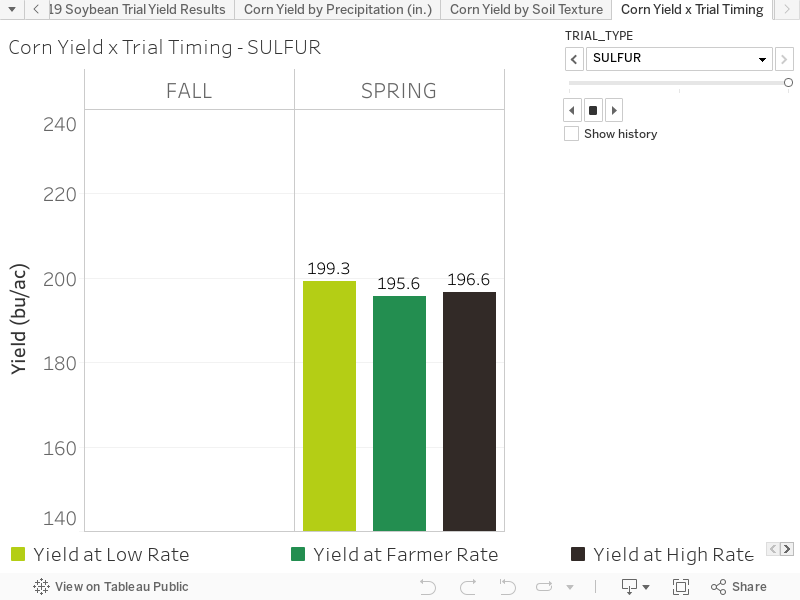
CHART 5
The chart above showcases the average yield performance in bushels of the three application rates from all trials evaluated by the timing of the application – fall or spring.
Insights from this graph:
- For nitrogen, there was only spring application trials conducted and low-rate nitrogen showed the lowest performance in yield measuring over 18 bushels below farmer rate nitrogen.
- For potassium, fall applications showed an overall higher yield response in corn versus the spring application rates with a 10.9 bushel increase over the spring application.
- For sulfur, there was only a spring application trial conducted.