
AFREC Funded On-Farm Research Trials
Beginning in 2017, AFREC funded an independent agronomist to conduct on-farm trials across the state of Minnesota. Utilizing precision agriculture data that many farmers are already recording, the trials were integrated into each farmer’s existing fertility plan and required minimal extra work and time for the farmer and their advisor.
Below are the insights from the trials.
2018 Research Trials
In 2018, 48 sites were established to measure corn yield response to increased and decreased rates of nitrogen fertilizer. These trials are replicated treatments that are designed to provide sound data. Since these trials only show data from 1-3 years, use the data to show trends and ideas for your crop management decisions, but combine it with other information and experiences on your own farm.
Findings from the 2018 Data
Below are a few key charts and graphs that showcase the results from the 2018 data. These charts are showcasing the raw data simply put into a chart to provide easier analysis and viewing. There are eight different charts available for display:
- Overall Yield Results
- Yield x Precipitation
- Yield x Precipitation x Trial Start Date
- Yield x Soil Texture
- Yield x Trial Timing
- Yield x Rate N x Timing
For these trials, farmer rate N application was based on the University of Minnesota nitrogen recommendations. Low rate N application was approximately 30 pounds less than farmer rate N and high rate N was approximately 30 pounds more than farmer rate N.
In the coming year, tools will be available to filter these charts by management practices and geographic location to provide customized views for farmers.
NOTE: to view details of the bars, hover your mouse over the bar to see the number of trials in each data average and other details related to the chart.
CHART 1
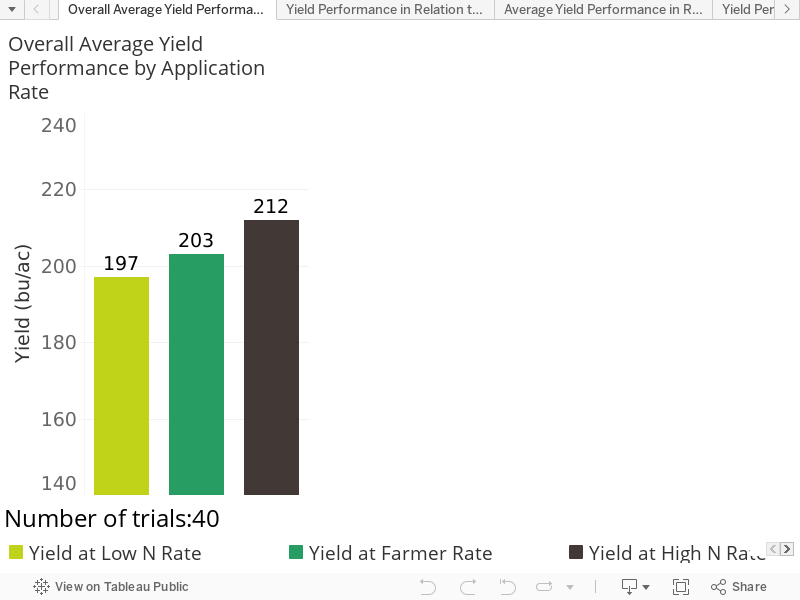
The chart above shows the average yield performance in bushels per acre in each of the application rate categories measured. Low Rate N is approximately 30 pounds less than Farmer Rate N and High Rate N is approximately 30 pounds more than Farmer Rate N. Farmer Rate N is based on the University of Minnesota Nitrogen Recommendations.
Insights from this graph:
- There is a linear progression of increase in yield with increased application of nitrogen each increase in nitrogen showcasing an increase of 6 to 7 bushels of yield.
CHART 2
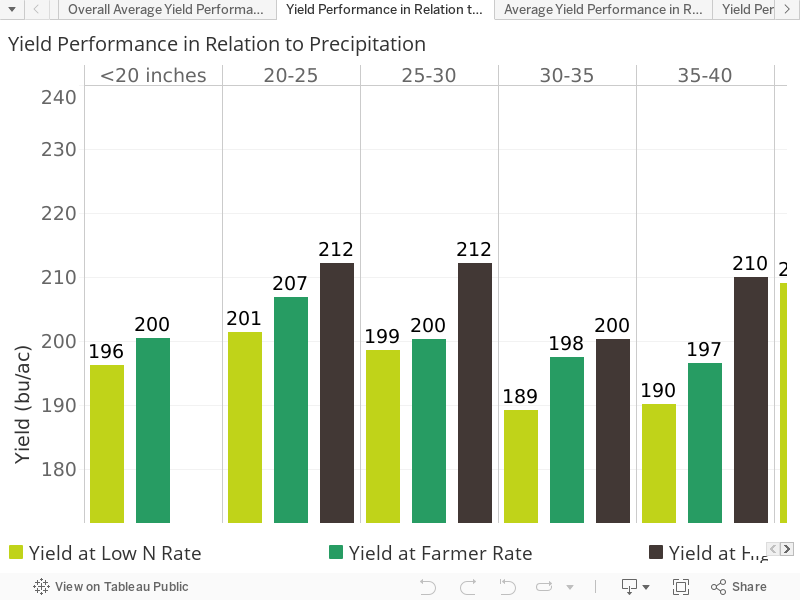
The chart above displays the variable yield results in bushels for each trial by the precipitation rate in inches during the growing season of March – September. Low Rate N is approximately 30 pounds less than Farmer Rate N and High Rate N is approximately 30 pounds more than Farmer Rate N. Farmer Rate N is based on the University of Minnesota Nitrogen Recommendations.
Insights from this graph:
- At all levels of precipitation, higher rate of N showed the largest yield performance in relation to the other application rates.
- All application rates showed decreased performance at 25 – 35 inches of precipitation during growing season March – September.
- The largest yield increase between farmer rate and higher rate N was shown at 35 – 40 inches of precipitation showing a 9.4 bushel increase in yield.
CHART 3
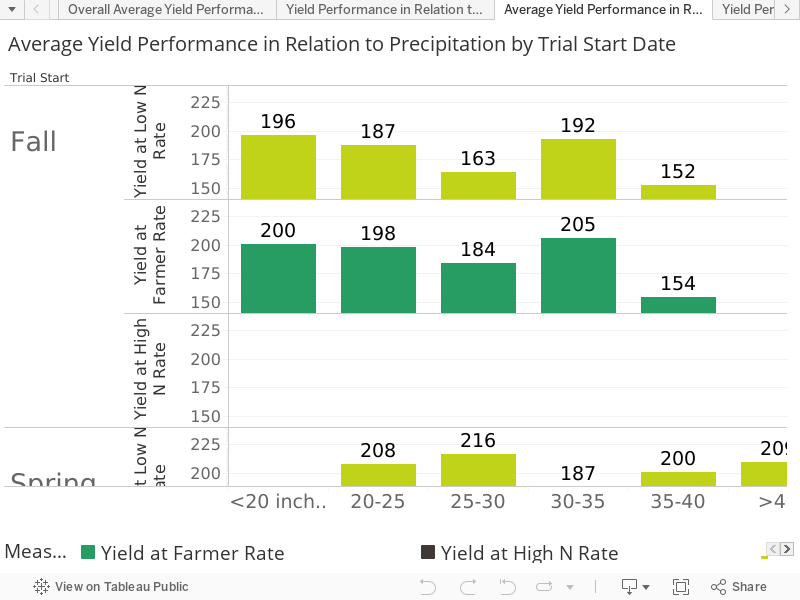
The charts above displays the average yield performance in bushels by precipitation amount in inches of the fall and spring start date trials. Low Rate N is approximately 30 pounds less than Farmer Rate N and High Rate N is approximately 30 pounds more than Farmer Rate N. Farmer Rate N is based on the University of Minnesota Nitrogen Recommendations.
Insights from this graph:
- Spring application trials indicated significantly increased yield performance with across the various levels of precipitation.
- Fall application of nitrogen showed a higher level of yield performance by 5.6 bushels in the 30-35 inch range of precipitation.
CHART 4
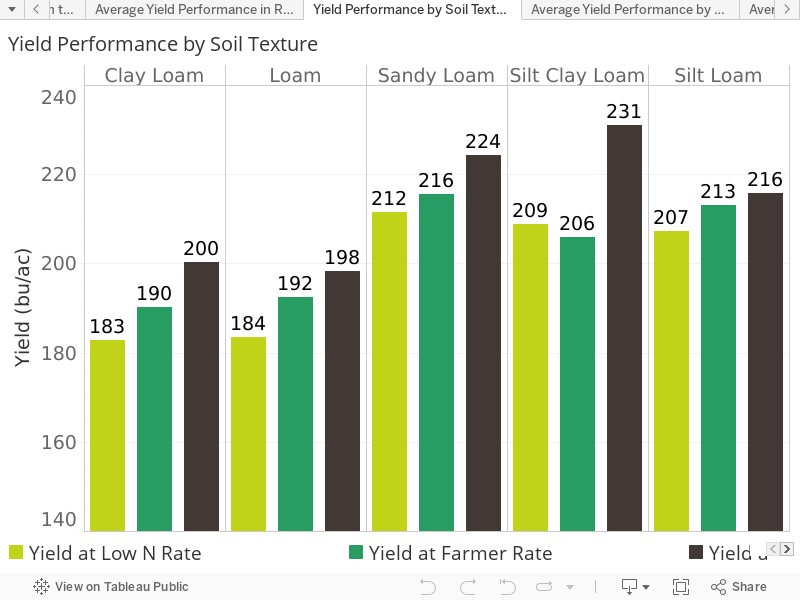
The chart above displays the yield results in bushels by soil textures found in each of the application rates. Low Rate N is approximately 30 pounds less than Farmer Rate N and High Rate N is approximately 30 pounds more than Farmer Rate N. Farmer Rate N is based on the University of Minnesota Nitrogen Recommendations.
Insights from this graph:
- Overall, increased rate N did show higher yield results in all soil texture groups related to the farmer and lower rate N.
- In the Silt Clay Loam soil texture group, there was a significant yield response to higher rate N with yield results showing an average 20 bushels higher than farmer rate and lower N.
- In the Silt Loam soil texture group, increased N did not show as significant of a yield response, only averaging 2.2 bushels higher than the farmer rate N average.
CHART 5
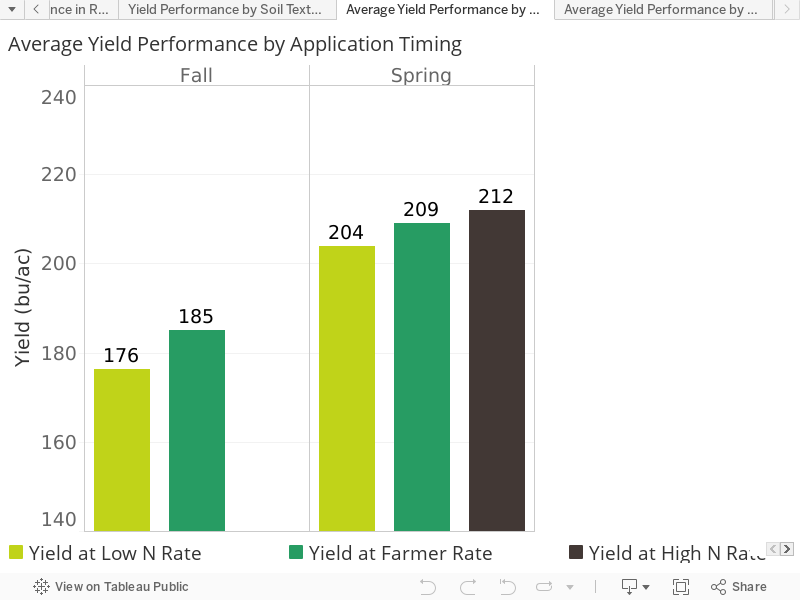
The chart above showcases the average yield performance in bushels of the three application rates from all trials evaluated by timing of application – fall or spring. Low Rate N is approximately 30 pounds less than Farmer Rate N and High Rate N is approximately 30 pounds more than Farmer Rate N. Farmer Rate N is based on the University of Minnesota Nitrogen Recommendations.
Insights from this graph:
- When comparing fall verses spring application timing yield response, it is evident that spring application rendered increases in yield response to all application rates verses fall application.
CHART 6
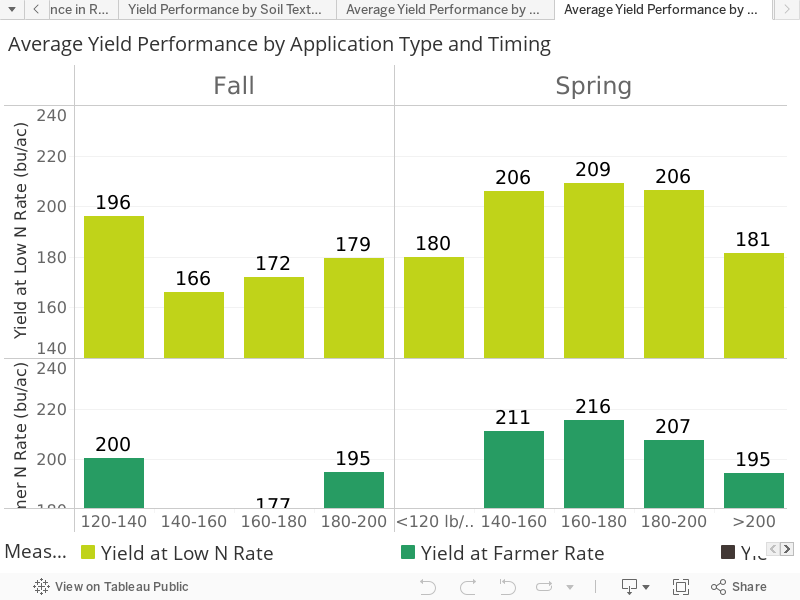
The chart above shows the average yield performance in bushels of the application rates in pounds by application timing. Low Rate N is approximately 30 pounds less than Farmer Rate N and High Rate N is approximately 30 pounds more than Farmer Rate N. Farmer Rate N is based on the University of Minnesota Nitrogen Recommendations.
Key findings from low rate N include:
- Overall, when both spring and fall application timing are considered, the nitrogen application rate of 100-140 pounds showcased the highest performance in yield by almost 6 bushels compared to the closest average.
- For spring application trials, low rate N application of 100-120 pounds outperformed the other application rates closely followed by 120-140 pounds.
- When evaluating the fall application trials alone, it was apparent evident that at low rate N, greater than 160 pounds applied significantly outperformed the other application rates by at least 29 bushels. Showing that increased rates of N are necessary with fall application.
Key findings from farmer rate N include:
- Three of the five application rates of farmer N showed average yield performance above 200 bushels – with 160-180 pounds showing an average 2.3 bushels higher than the 140-160 pound application rate.
- When looking at both fall and spring application timings, farmer rates less than 120 pounds and more than 180 pounds did not show the yield performance as the rates in between.
- Spring application timing showed increased variation between the farmer rate N application amounts with 140 – 180 pounds performing at almost 10 bushels higher than any other rates. Specifically, 160-180 pounds showed the highest performance of yield at 215.7 bushels.
- For fall application rates of farmer N, the data showed highest yield performance at both ends of the application spectrum – finding 120-140 and 180-200 applied pounds to be the yield the highest.
Key findings from high rate N Include:
- The average yield performance for spring showed 160-200 pounds N yielded the highest crop with over 216 bushels which was 10 bushels higher than the next application rate which was more than 220 pounds and above.
- There were no fall trials of higher rate N.